How to Install and Use the VMware vSphere Overview Dashboard in Grafana
Configure Telegraf, InfluxDB, and Grafana to build a comprehensive monitoring stack for VMware vSphere environments.
How to Install and Use the VMware vSphere Overview Dashboard in Grafana
Effective vSphere monitoring requires visibility into host and VM performance metrics over time. The VMware vSphere Overview Dashboard in Grafana provides this capability by integrating Telegraf metric collection with InfluxDB time-series storage.
This guide covers the complete monitoring stack deployment from Telegraf configuration to dashboard import.
Prerequisites
Required components:
-
Grafana Installed: A running Grafana instance. Follow the Grafana installation guide if needed.
-
VMware vSphere Environment: The vSphere infrastructure you intend to monitor.
-
vCenter Server: API access to your vCenter server with appropriate credentials.
Step 1: Install Telegraf
Telegraf serves as the metrics collection agent, gathering performance data from vCenter and forwarding it to InfluxDB.
- Download and Install Telegraf:
sudo apt-get update
sudo apt-get install telegraf
- Configure Telegraf: Open the Telegraf configuration file:
sudo nano /etc/telegraf/telegraf.conf
Add the vSphere input plugin configuration:
[[inputs.vsphere]]
  vcenters = [""]
  username = "your-vcenter-username"
  password = "your-vcenter-password"
  insecure_skip_verify = true

  ## Specific configuration for the vCenter
  interval = "60s"

  ## VMs
  vm_metric_include = [
    "cpu.*",
    "mem.*",
    "net.*",
    "disk.*"
  ]

  ## Hosts
  host_metric_include = [
    "cpu.*",
    "mem.*",
    "net.*",
    "disk.*"
  ]
- Restart Telegraf:
sudo systemctl restart telegraf
Step 2: Configure InfluxDB
InfluxDB stores the time-series metrics collected by Telegraf and serves as the data source for Grafana queries.
- Install InfluxDB:
sudo apt-get update
sudo apt-get install influxdb
- Start InfluxDB:
sudo systemctl start influxdb
sudo systemctl enable influxdb
- Create a Database for vSphere Metrics:
influx
In the InfluxDB shell, create the metrics database:
CREATE DATABASE vsphere_metrics
- Configure Telegraf to Send Metrics to InfluxDB: Open the Telegraf configuration file:
sudo nano /etc/telegraf/telegraf.conf
Add the InfluxDB output configuration:
[[outputs.influxdb]]
  urls = [""]
  database = "vsphere_metrics"
Restart Telegraf to apply the configuration:
sudo systemctl restart telegraf
Step 3: Configure Grafana
-
Access Grafana: Navigate to
http://your-grafana-server:3000and authenticate with your credentials. -
Add InfluxDB as a Data Source: Open the configuration menu from the sidebar.
-
Select "Data Sources" and click "Add data source."
-
Choose "InfluxDB" from the available options.
-
Configure the connection: URL:
http://localhost:8086 -
Database:
vsphere_metrics -
User: (leave blank if not configured)
-
Password: (leave blank if not configured)
-
Click "Save & Test" to validate the data source connection.
-
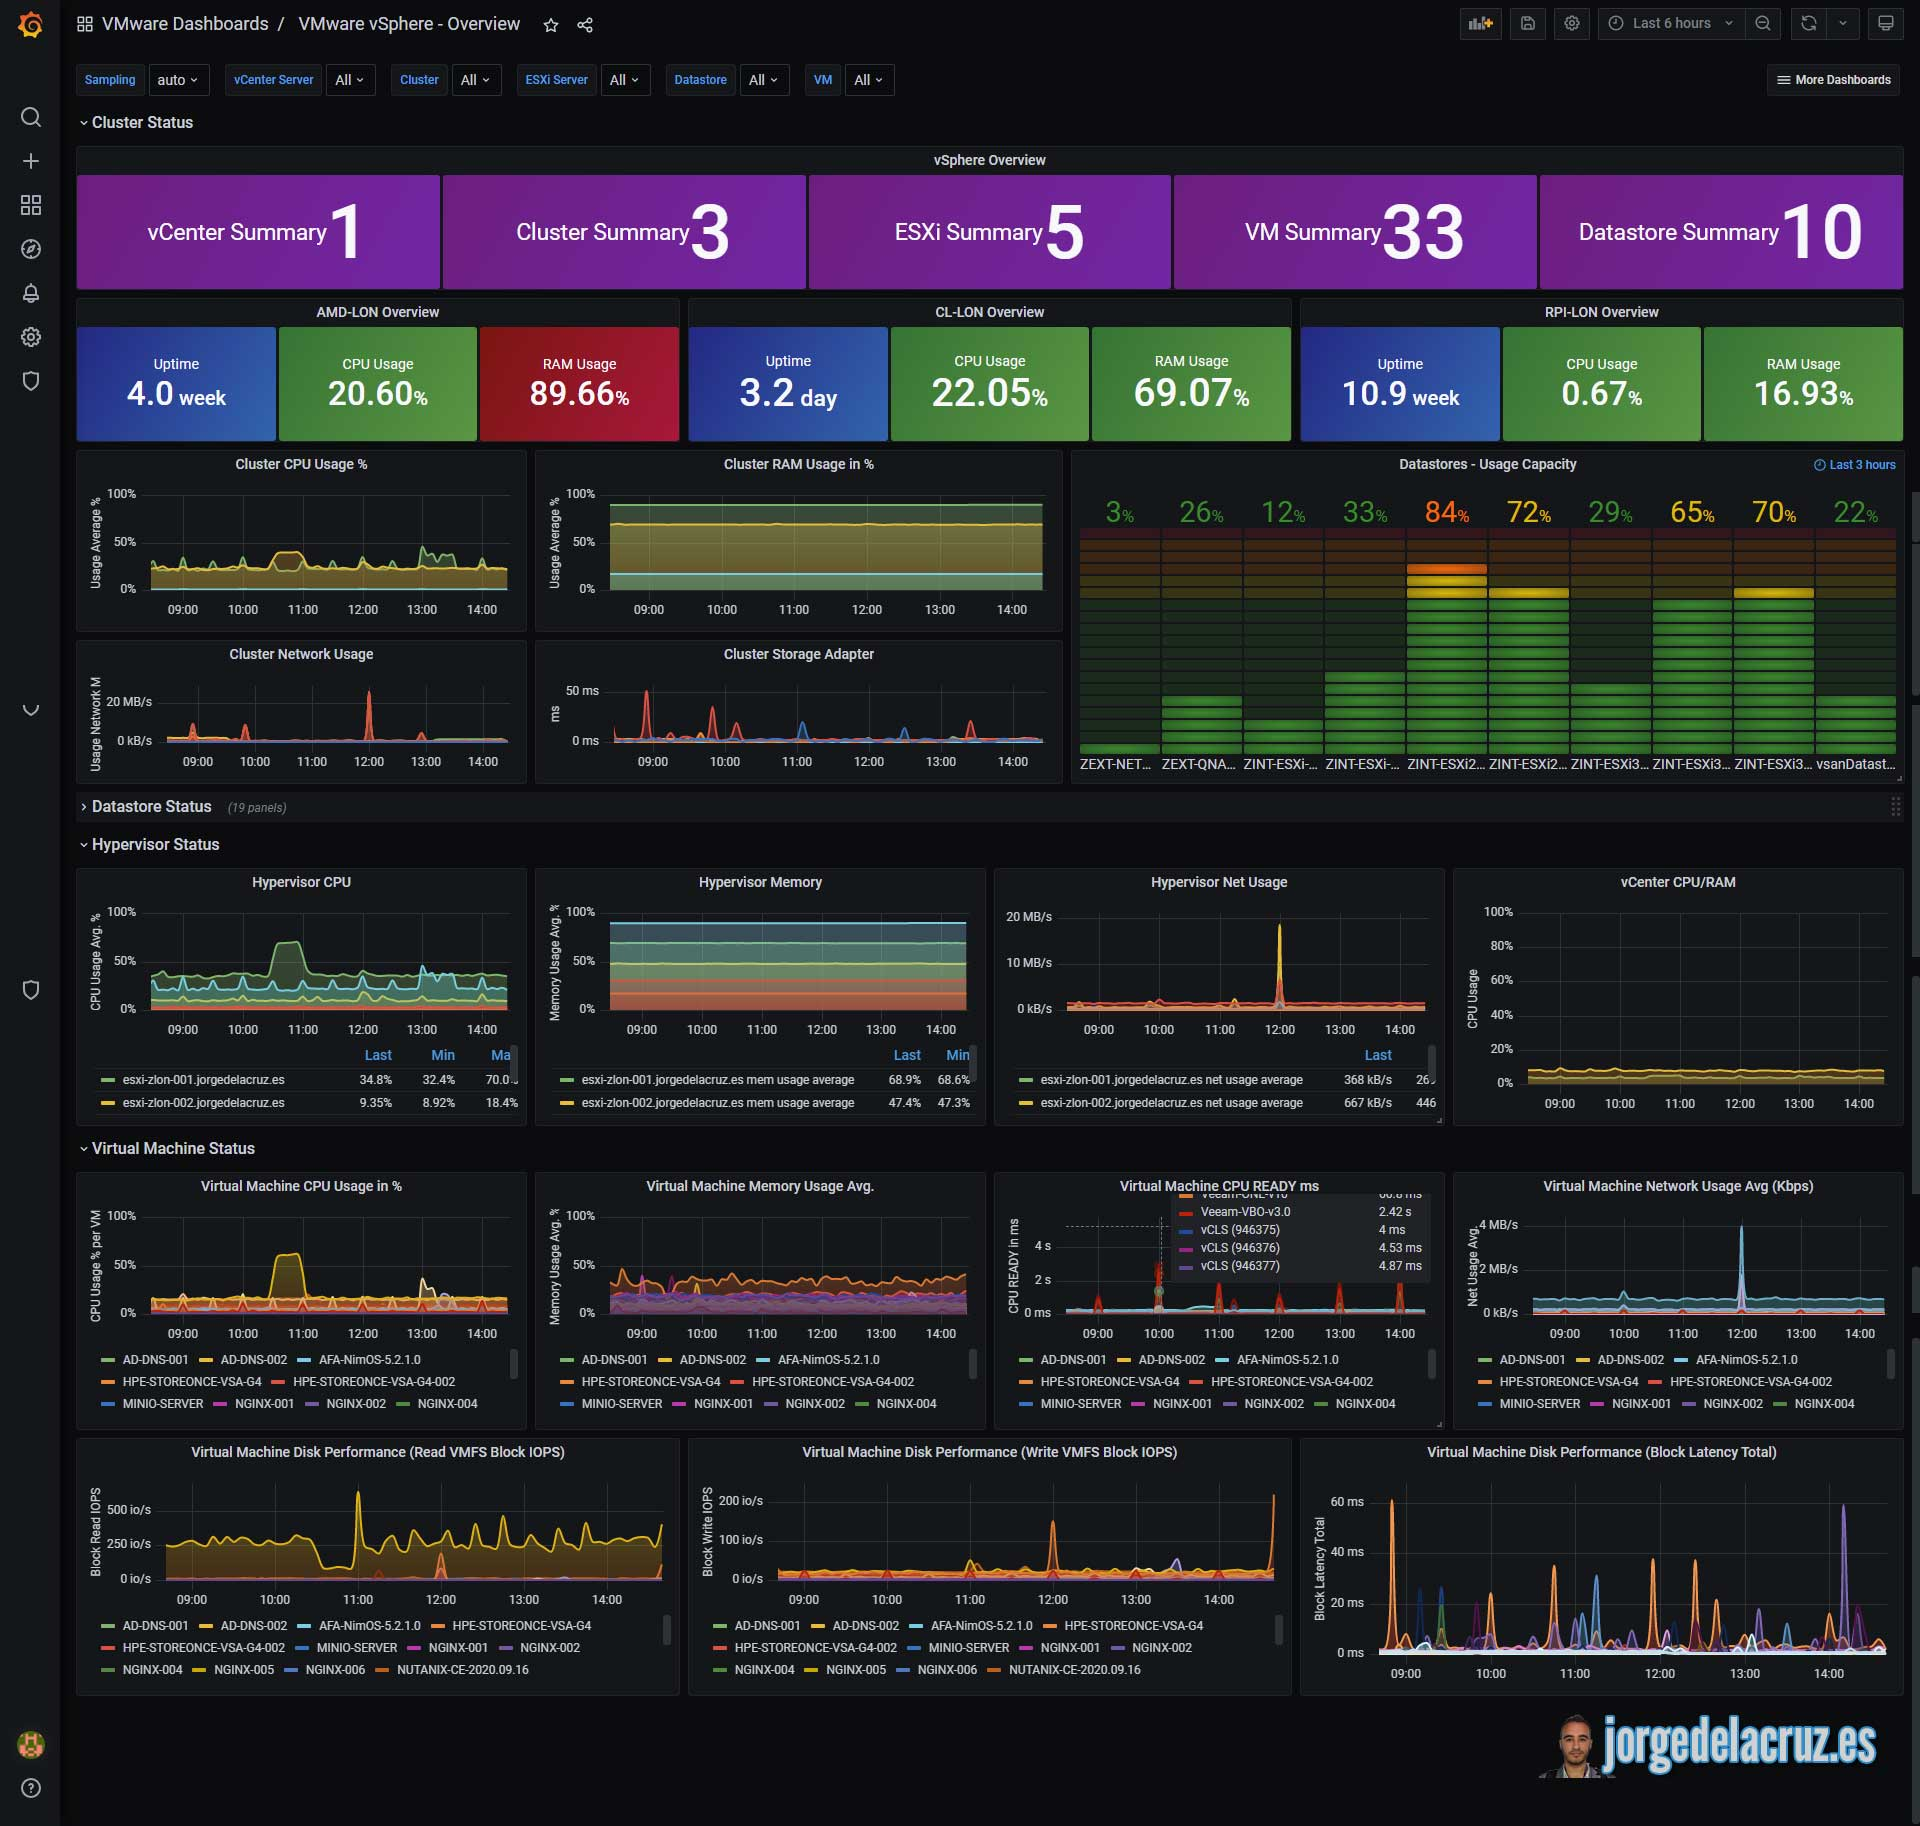
Import the vSphere Overview Dashboard: Navigate to the VMware vSphere Overview Dashboard.
-
Note the dashboard ID:
8159. -
In Grafana, click the "+" icon in the sidebar, then select "Import."
-
Enter dashboard ID
8159and click "Load." -
Select your InfluxDB data source.
-
Click "Import" to complete the process.
Step 4: Verify and Customize the Dashboard
-
Verify Data: Confirm metrics are populating the dashboard panels. Initial data may take several minutes to appear depending on the configured collection interval.
-
Customize the Dashboard: Modify panels to match your monitoring requirements. Configure alert rules to trigger notifications when metrics exceed defined thresholds.

Key Takeaways
- Telegraf with the vSphere input plugin collects metrics directly from vCenter API
- InfluxDB provides efficient time-series storage optimized for metric retention and queries
- The 60-second collection interval balances granularity with vCenter API overhead
- Dashboard ID 8159 provides pre-built visualizations for common vSphere metrics
- Custom alert rules enable proactive notification of performance issues
Written by Bar Tsveker
Senior CloudOps Engineer specializing in AWS, Terraform, and infrastructure automation.
Thanks for reading! Have questions or feedback?